Jack Montgomery, MLS(ASCP)cm

Montgomery
October 2017—The challenge for all clinical laboratories is to produce the highest quality in vitro diagnostic results in the most efficient manner. Fortunately, high quality and high efficiency are not mutually exclusive, and the direct correlation between the two is well documented.1,2 As the quality of processes increases, so does process efficiency, which ultimately drives down costs.
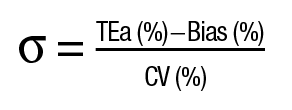
Since the modern clinical laboratory is often perceived as a factory of test results, it is no surprise that sigma metrics—widely used in manufacturing processes as a measure of defects per million (dpm)—are often used in laboratory quality control and quality assurance processes. In this context, the sigma metric of an assay is based on the precision (CV%) and accuracy (bias%) of an assay against a predefined percent total error allowable (TEa%) specification:

The sigma metric of an assay reflects the probability of an erroneous test result. A sigma metric of six (3.4 dpm) or above is considered “world class,” and a sigma metric below three (66,807 dpm) means an assay “needs improvement.” The goal is to have as many five and six sigma processes as possible. These values can thus be used to set up assay-specific QC protocols, according to Westgard rules.3
Proposed TEa values for different assays can be obtained from a number of recognized sources,4–8 while the Clinical Laboratory Improvement Amendments specify the minimum regulatory compliance requirement in the U.S.5 The error allowed for regulated analytes mandated by CLIA can be expressed in terms of a percentage, absolute concentration, or both and can vary greatly between measurands. For example, the extent of this variation can be seen in the TEa values of alanine aminotransferase (ALT) at 20 percent, calcium at 1.0 mg/dL, cholesterol at 10 percent, and glucose at 6.0 mg/dL or 10 percent. In addition to those of CLIA, some of the commonly cited TEa sources are from Dr. Carmen Ricós and colleagues (Spanish consensus using biologic variation),6 German Guidelines for Quality (RiliBÄK),7 and Australian RCPA.8 The often significant variation in recommended TEa among the sources—as well as the lack of a unified protocol for measuring the values of bias and precision—introduces uncertainty in interpretation and generalizability of the published sigma metrics for various assays, which may confound head-to-head comparisons of assays from different manufacturers. Examples of such variations can be seen between published TEa source limits other than CLIA of the same analytes mentioned earlier: ALT (Ricós: 27.48 percent, RiliBÄK: 21 percent, RCPA: 12 percent); calcium (Ricós: 2.55 percent, RiliBÄK: 10 percent, RCPA: four percent); cholesterol (Ricós: 9.01 percent, RiliBÄK: 13 percent, RCPA: six percent); and glucose (Ricós: 6.96 percent, RiliBÄK: 15 percent, RCPA: eight percent). In addition to selecting the appropriate TEa to maintain regulatory compliance, it is also wise to consult clinicians to ascertain the quality necessary to drive appropriate medical decisions.
Sigma metric analysis is only one of the tools in the laboratory QC/QA arsenal. While each sigma calculation can define an individual assay’s performance at one point in time, the clinical laboratory is a dynamic entity with an array of moving parts, and metrics often move over time. Whatever metrics are used to guide laboratory operations, they must remain monitored, which requires constant and careful consideration.
Case study
The laboratory. Asante Rogue Regional Medical Center (RRMC), Medford, Ore., is the 378-bed flagship referral and trauma center for Asante, a growing three-hospital health system incorporating a group of medical professionals, Asante Physician Partners, serving southern Oregon and northern California. RRMC was named a Truven Health Analytics Top 100 hospital in 2014, 2015, 2016, and 2017. It was also recently deemed a Top 100 cardiovascular hospital and Top 15 health system. The core laboratory resides within RRMC and performs more than 3 million laboratory tests per year.
QC ramifications of chemistry system upgrade. In 2015, RRMC laboratory embarked on a project to upgrade its nearly 10-year-old Beckman Coulter Power Processor laboratory automation system with Beckman Coulter’s Power Express total laboratory automation. The upgrade would allow RRMC to boost the throughput of the automation line from 700 to 1,200 tubes per hour and interconnect four major laboratory disciplines.
The four-lane track, designed with T-lanes, was set up with a dynamic inlet, three centrifuges, dual decappers, dual aliquoters, a labeler, dual recappers, an outlet, and a 5K storage unit. The final instrument configuration is composed of two new modular chemistry analyzers (Beckman Coulter AU5812 primary chemistry instruments, each with two ISE units), three immunochemistry analyzers (two Beckman Coulter DxI 600s and one Siemens Centaur XP), two hematology workcells with a slide-staining module (Beckman Coulter DxHs), and one coagulation analyzer (Instrumentation Laboratory Top 700). The introduction of the new chemistry system (AU versus incumbent DxC) required evaluation of the system’s biases, coefficients of variation, decision levels (Xc), and other metrics (e.g. AMR, reference intervals) in accordance with the RRMC quality system.
Method
The options for evaluating sigma metrics during the system-to-system transition included method validation studies or the use of external QC. The former is easier to implement but suffers from two theoretical limitations:
- Most method validation studies use a comparison of field methods rather than a comparison with a standardized reference method. Therefore, a calculation of bias in the relationship between the candidate method (y) and the comparative method (x) might not be the best possible measure.
- Imprecision experiments performed during method validation studies might not offer sufficient duration to best capture an individual assay’s CV% over time for the sigma calculation.
Therefore, to maximize the rigor of the evaluation, RRMC opted for an external QC technique, using two levels of QC material (Bio-Rad Liquichek Unassayed Chemistry Control) as the basis to determine each assay’s bias and CV%. The data were accumulated over four months, yielding more than 100 data points per assay level with a comparative peer group often exceeding 100 laboratories. CLIA-defined TEa values were used to maintain regulatory compliance.
Results
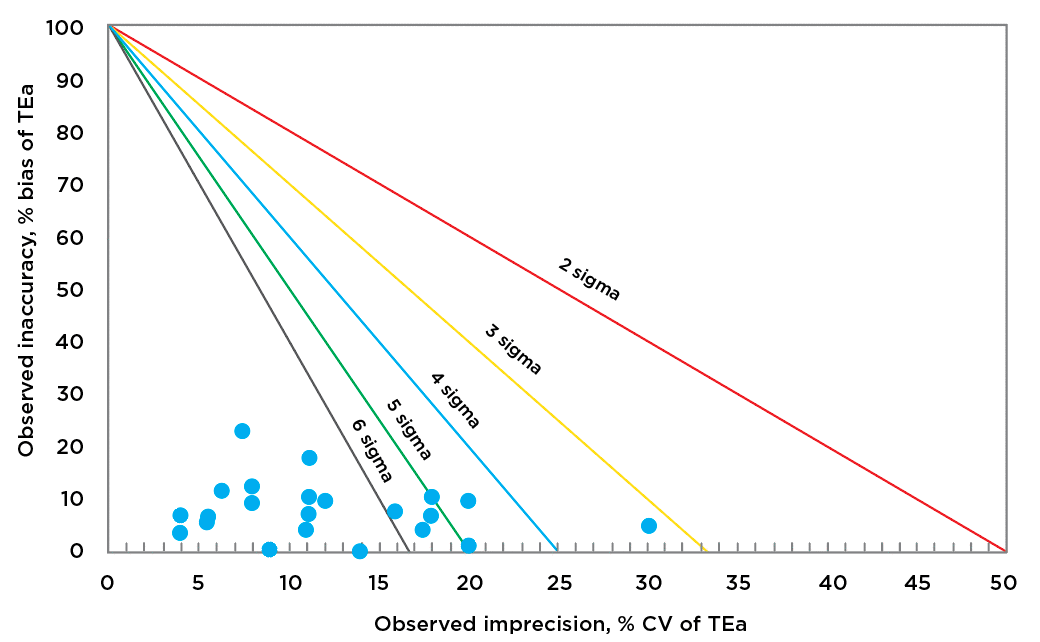
RRMC examined 22 CLIA-regulated general chemistry analytes across both AU5812 platforms, calculating sigma values at two levels of concentration each, which then became the de facto “decision limits” (Xc) for each analyte. Each analyzer’s sigma values were plotted on discrete, normalized operational process specification (OPSpec) charts to clearly show the distribution of sigma values ranging from six to three.
One AU5812 (nicknamed Zeus and maintained by the day shift) was evaluated for 22 assays (see list of analytes evaluated, Fig. 1) at two QC levels each. The level two QC data showed 15 assays at six sigma or greater. The remaining were four assays at five sigma, two at four sigma, and one at three sigma or greater, as shown in Fig. 1. When evaluated for the level one QC, the results were similar. All TEa values used in calculation of sigma values were CLIA specifications per published sources.5

Fig. 1. Xc (decision limit) level two data from AU5812 (Zeus)
Analytes evaluated: albumin, ALP, ALT, amylase, AST, bilirubin total, calcium, chloride, cholesterol, CK, creatinine, glucose, HDL cholesterol, iron, LDH, magnesium, potassium, sodium, total protein, triglyceride, urea nitrogen, uric acid.
Of note, the sigma values of the assays obtained on the Zeus AU5812 analyzer were comparable to those published by the manufacturer on the basis of method validation studies and bias/variability data published in the system’s instructions for use.9
In comparison, the second AU5812 system (nicknamed Apollo and maintained by the night shift) had 30 of 44 control levels at six sigma or greater. The remaining levels were six at five sigma, three at four sigma, and five at three sigma.
In studying the performance between the two AU instruments, with particular focus on cholesterol, we found the Zeus analyzer had smaller CV percentages (2.0, 1.8) and higher sigma values (4.3, 5.1) than the Apollo’s higher CVs (2.7, 2.8) and lower sigma values (3.5, 3.5). This observation led to an increase in the frequency and monitoring of the Apollo’s sample probes, syringe replacement, and instrument maintenance schedules. For example, rather than replace individual sample and reagent syringes on an as-needed basis whenever a failure occurred (e.g. visible leaking, discoloration), new preventive measures dictated that all syringes be replaced on a universal six-month replacement cycle. CV% limits were also set for indicator assays such as cholesterol that might cause an assay’s sigma value (with negligible bias) to fall below five as a stopping point to further examine the system for causes of random vari-ation. As a result, the next month’s quality assurance program data indicated significant improvement in the Apollo analyzer’s cholesterol CV percentages (1.3, 1.4) and sigma values (7.4, 7.1), thus raising the cholesterol sigma level above six for the entire month. Continued monitoring of performance was warranted, and the improvements continued in subsequent months (Fig. 2).
 CAP TODAY Pathology/Laboratory Medicine/Laboratory Management
