 CAP TODAY Pathology/Laboratory Medicine/Laboratory Management

Editor: Frederick L. Kiechle, MD, PhD
Submit your pathology-related question for reply by appropriate medical consultants. CAP TODAY will make every effort to answer all relevant questions. However, those questions that are not of general interest may not receive a reply. For your question to be considered, you must include your name and address; this information will be omitted if your question is published in CAP TODAY.
Q. I come from a core (hematology/chemistry) background, and I would like practical, how-to guidance in developing an effective QC strategy for HIV viral load testing. What performance characteristics do you verify? How many and what type of samples do you use? What are the chosen acceptable thresholds? Do you use L-J charts? If so, what do you plot, what control rules do you select, and how do you select them?
A. HIV viral load testing is an important aspect of patient care. Offering the testing in-house may allow for more timely management and counseling of patients with HIV. However, given the potential severity of inappropriately managed HIV, laboratories should not implement testing without careful assay verification and subsequent quality assurance.
Verification. For verification of HIV viral load testing, one must carefully evaluate precision, analytical sensitivity and specificity, accuracy, linearity, percentage carryover, reportable range of the assay, and reference interval.1,2
Accuracy can be characterized through a method correlation study. This involves obtaining samples from a laboratory currently performing HIV viral load testing using a validated HIV viral load assay. Typically, samples should consist of at least 20–40 positive and quantifiable specimens spanning the reportable range of the assay.1 Negative samples should also be included (typically at least 20). These positive and negative samples should be tested as unknowns using the method to be evaluated, and results should be compared with those obtained previously in a qualitative and quantitative manner. Qualitative comparison can be accomplished through a standard 2 by 2 accuracy matrix, allowing for the calculation of positive percent agreement, negative percent agreement, and overall percent agreement. Quantitative comparison can be accomplished by plotting the results obtained by the previous method against the results obtained by the test method. Regression analysis (typically Passing-Bablok or Deming regression) of this plot can be used to determine the y-intercept and coefficient of determination (R2), which provide information about assay bias and the relationship between results.
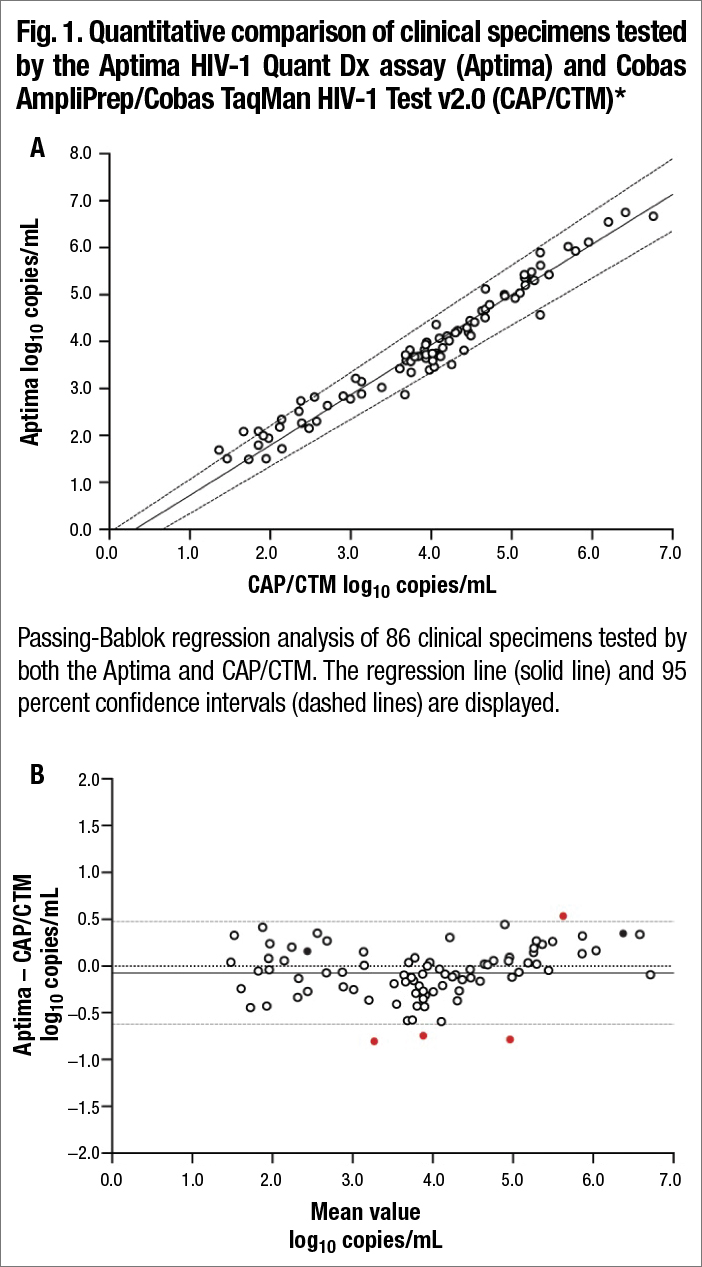
Bland-Altman plot comparing Aptima with CAP/CTM. The bias (solid line) was −0.075 log10 copies/mL. The 95 percent limits of agreement (gray dashed lines) and zero line (dotted black line) are also shown. Outliers are shown as filled red circles. Samples harboring integrase mutations are shown as filled black circles. *From Sahoo MK, Varghese V, White E, et al. Evaluation of the Aptima HIV-1 Quant Dx assay using plasma and dried blood spots. J Clin Microbiol. 2016;54(10)2597–2601. Reproduced with permission from the American Society for Microbiology.